You've already forked ada_language_server
mirror of
https://github.com/AdaCore/ada_language_server.git
synced 2026-02-12 12:45:50 -08:00
patternMatcher.severity can only have for value "error|warning|info".
This is too restrictive for all the possible values from our tools.
As a workaround create 3 patternMatcher for each of the level.

Add a test

Closes eng/ide/ada_language_server#784
406 lines
15 KiB
Markdown
406 lines
15 KiB
Markdown
# Using Ada in VS Code
|
|
|
|
In this tutorial, you will configure Visual Studio Code to use the GCC
|
|
Ada compiler (GNAT) and GDB debugger on Linux, Windows or Mac OS X. GCC
|
|
stands for GNU Compiler Collection; GNAT is GNU Ada Translator in GCC;
|
|
GPRbuild is a multi-language builder; GDB is the GNU debugger.
|
|
|
|
After configuring VS Code, you will compile and debug a simple Ada project
|
|
in VS Code. This tutorial does not teach you GCC, GDB, Ubuntu or the Ada
|
|
language. For those subjects, there are many good resources available on
|
|
the Web.
|
|
|
|
If you have trouble, feel free to file an issue for this tutorial in the
|
|
ada_language_server
|
|
[repository](https://github.com/AdaCore/ada_language_server).
|
|
|
|
## Prerequisites
|
|
|
|
To successfully complete this tutorial, you must do the following:
|
|
|
|
* Install [Visual Studio Code](https://code.visualstudio.com/download).
|
|
|
|
* Install the
|
|
[Ada & SPARK extension for VS Code](https://marketplace.visualstudio.com/items?itemName=AdaCore.ada).
|
|
You can install the extension by searching for 'adacore' in the
|
|
Extensions view (`Ctrl+Shift+X`).
|
|
|
|

|
|
|
|
### Ensure GNAT is installed
|
|
|
|
Although you'll use VS Code to edit your source code, you'll compile the
|
|
source code using the GNAT compiler. You'll also use GDB to debug and
|
|
[gprbuild](https://docs.adacore.com/gprbuild-docs/html/gprbuild_ug/building_with_gprbuild.html)
|
|
to build applications or libraries. These tools are not installed by default,
|
|
so you have to install them. Fortunately, that's easy.
|
|
|
|
If you are an [AdaCore](https://www.adacore.com/) customer, log into your account on [GNAT Tracker](https://support.adacore.com/csm) to download the tools available in your subscription.
|
|
|
|
Otherwise, Ada & SPARK tools are available to the community through different channels listed [here](https://github.com/AdaCore/ada_language_server/tree/master/integration/vscode/ada#getting-additional-tools).
|
|
|
|
## Create Hello World
|
|
|
|
From the terminal window, create an empty folder called `projects` to
|
|
store your VS Code projects. Then create a subfolder called `helloworld`,
|
|
navigate into it, and open VS Code in that folder by entering the following
|
|
commands:
|
|
|
|
mkdir projects
|
|
cd projects
|
|
mkdir helloworld
|
|
cd helloworld
|
|
code .
|
|
|
|
The `code .` command opens VS Code in the current working folder, which
|
|
becomes your "workspace".
|
|
|
|
### Create a project file
|
|
|
|
The
|
|
[GNAT project file](https://docs.adacore.com/gprbuild-docs/html/gprbuild_ug/gnat_project_manager.html)
|
|
allows you to manage complex builds involving a number of source files,
|
|
directories, and options for different system configurations. It is
|
|
recommended to create a project file even for the simplest Ada project.
|
|
|
|
In the File Explorer title bar, select **New File** and name the file
|
|
`hello_world.gpr`.
|
|
|
|

|
|
|
|
Paste in the following source code:
|
|
|
|
```
|
|
project Hello_World is
|
|
for Main use ("hello_world.adb");
|
|
for Object_Dir use ".objs";
|
|
|
|
package Compiler is
|
|
for Default_Switches ("Ada") use ("-g");
|
|
end Compiler;
|
|
end Hello_World;
|
|
```
|
|
|
|
Now press `Ctrl+S` to save the file.
|
|
|
|
### Add hello world source code file
|
|
|
|
In the File Explorer title bar, select **New File** and name the file
|
|
`hello_world.adb`.
|
|
|
|
Paste in the following source code:
|
|
|
|
```ada
|
|
with Ada.Text_IO;
|
|
|
|
procedure Hello_World is
|
|
begin
|
|
Ada.Text_IO.Put_Line ("Hello Ada World!");
|
|
end Hello_World;
|
|
```
|
|
|
|
Now press `Ctrl+S` to save the file. Notice that your files are listed
|
|
in the **File Explorer** view (`Ctrl+Shift+E`) in the side bar of VS Code:
|
|
|
|

|
|
|
|
You can also enable
|
|
[Auto Save](https://code.visualstudio.com/docs/editor/codebasics#_saveauto-save)
|
|
to automatically save your file changes, by checking **Auto Save** in the
|
|
main **File** menu.
|
|
|
|
The Activity Bar on the edge of Visual Studio Code lets you open different
|
|
views such as **Search**, **Source Control**, and **Run**. You'll look at
|
|
the **Run** view later in this tutorial. You can find out more about the
|
|
other views in the VS Code
|
|
[User Interface documentation](https://code.visualstudio.com/docs/getstarted/userinterface).
|
|
|
|
### Current project file configuration
|
|
|
|
It's important to configure the current project file setting. Open
|
|
**Settings View** with menu **File** > **Preferences** > **Settings**
|
|
(`Ctrl+Comma`), select **Workspace** tab, click **Extensions/Ada & SPARK**
|
|
and find the **Project File** input field. Type `hello_world.gpr`
|
|
value.
|
|
|
|

|
|
|
|
### Environment configuration
|
|
|
|
On first use, you may see the following warnings:
|
|
|
|
```
|
|
The project was loaded, but no Ada runtime found. Please check the installation of the Ada compiler.
|
|
can't find a toolchain for the following configuration: language 'Ada', target 'x86_64-linux', default runtime
|
|
```
|
|
|
|
This means that the GNAT compiler installation is not visible to VS Code. You can address this by setting up the `PATH` environment variable prior to opening VS Code, or by using the VS Code setting `terminal.integrated.env.[linux|windows|osx]`. Both methods are documented [on the extension's main page](https://github.com/AdaCore/ada_language_server/tree/master/integration/vscode/ada#environment-setup).
|
|
|
|
### Explore IntelliSense
|
|
|
|
In the `hello_world.adb` file, hover over `Put_Line` to see subprogram
|
|
information. After the begin keyword, start typing `Ada.Text_IO.` as
|
|
you would when calling a package procedure. You should immediately see
|
|
a completion list that shows all the subprograms in the package, and
|
|
a window that shows the entity information:
|
|
|
|

|
|
|
|
You can press the `Tab` key to insert the selected name. Then, when you
|
|
add the opening parenthesis, you'll see information about arguments that
|
|
the subprogram requires.
|
|
|
|
## Build hello_world
|
|
|
|
To build a simple project, you can use the `ada: Build current project`
|
|
predefined task. Predefined tasks are VS Code tasks that are created
|
|
by the extension itself.
|
|
|
|
To do that, just invoke the VS Code `Command Palette` via the 'Ctrl+Shift+B'
|
|
shortcut (or `Cmd+Shift+B` on Mac OS): then search for the `Run Task`
|
|
command and type `ada`. Clicking on the `ada` entry will show
|
|
you all the Ada related tasks, in particular the `ada: Build current project`
|
|
one. Select it and press ENTER (or click on it) to actually build your project.
|
|
|
|
If your are dealing with a complex project, that requires different build steps or
|
|
more advanced options, you can create a custom `tasks.json` file to tell VS Code
|
|
how to build (compile) the program. This task will invoke the `gprbuild` tool to
|
|
create an executable file from the source code.
|
|
|
|
From the main menu, choose **Terminal** > **Configure Default Build Task**.
|
|
A dropdown appears showing various predefined build tasks for Ada compilers.
|
|
Choose **ada: Build current project**.
|
|
|
|
This will create a `tasks.json` file in a `.vscode` folder and open it
|
|
in the editor.
|
|
|
|
Your new `tasks.json` file should look similar to the JSON below:
|
|
|
|
```json
|
|
{
|
|
"version": "2.0.0",
|
|
"tasks": [
|
|
{
|
|
"type": "ada",
|
|
"command": "gprbuild",
|
|
"args": [
|
|
"${command:ada.gprProjectArgs}",
|
|
"-cargs:ada",
|
|
"-gnatef"
|
|
],
|
|
"problemMatcher": [
|
|
"$ada-error",
|
|
"$ada-warning",
|
|
"$ada-info"
|
|
],
|
|
"group": {
|
|
"kind": "build",
|
|
"isDefault": true
|
|
},
|
|
"label": "ada: Build current project"
|
|
}
|
|
]
|
|
}
|
|
```
|
|
|
|
> Note: You can learn more about `tasks.json` variables in the
|
|
[variables reference](https://code.visualstudio.com/docs/editor/variables-reference).
|
|
|
|
The `command` setting specifies the program to run; in this case that
|
|
is `gprbuild`. The `args` array specifies the command-line arguments
|
|
that will be passed to `gprbuild`. These arguments must be specified
|
|
in the order expected by the tool.
|
|
|
|
This task tells `gprbuild` to take the project filename and associated scenario variables from the VS Code settings
|
|
(`${command:ada.gprProjectArgs}`), compile the project, and create an executable file
|
|
according to project file rules, resulting in `hello_world` for our example.
|
|
|
|
The `label` value is what you will see in the tasks list; you can name
|
|
this whatever you like.
|
|
|
|
The `"isDefault": true` value in the `group` object specifies that this
|
|
task will be run when you press `Ctrl+Shift+B`. This property is for
|
|
convenience only; if you set it to false, you can still run it from
|
|
the Terminal menu with **Tasks: Run Build Task**.
|
|
|
|
## Running the build
|
|
|
|
1. To run the build task defined in `tasks.json`, press `Ctrl+Shift+B`
|
|
or from the **Terminal** main menu choose **Run Build Task**.
|
|
|
|
2. When the task starts, you should see the Integrated Terminal panel
|
|
appear below the source code editor. After the task completes, the
|
|
terminal shows output from the compiler that indicates whether the
|
|
build succeeded or failed. For a successful g++ build, the output
|
|
looks something like this:
|
|
|
|

|
|
|
|
3. Create a new terminal using the `+` button and you'll have a terminal
|
|
running your default shell with the `helloworld` folder as the working
|
|
directory. Run `ls .objs` and you should now see the executable
|
|
hello_world (no file extension).
|
|
|
|

|
|
|
|
4. You can run `helloworld` in the terminal by typing `.objs/helloworld`.
|
|
|
|
## Check current file
|
|
|
|
Another task (`ada: Check current file`) could be used to
|
|
quickly check syntax and semantic of the current file in the editor.
|
|
If the compiler finds some errors VS Code will populate **Problems view**
|
|
and highlight corresponding lines in the editor. It's handy to have
|
|
a keyboard shortcut for this task. To create one:
|
|
|
|
* Click **View** > **Command Palette...** (`Ctrl+Shift+P`) and
|
|
type **Preferences: Open Keyboard Shortcuts (JSON)**
|
|
|
|
* Append this to the shortcut list:
|
|
|
|
```json
|
|
{
|
|
"key": "alt+v",
|
|
"command": "workbench.action.tasks.runTask",
|
|
"args": "ada: Check current file",
|
|
"when": "editorLangId == ada"
|
|
},
|
|
```
|
|
|
|
## Debug hello_world.adb
|
|
|
|
Let's try to debug our program now.
|
|
|
|
The [ms-vscode.cpptools](https://github.com/microsoft/vscode-cpptools) extension
|
|
is automatically installed along with this extension, allowing to use its
|
|
integration for GDB to debug Ada code.
|
|
|
|
The extension provides default debug configurations for all the mains of your
|
|
project. You can debug the executable of your choice by opening the
|
|
`Run and Debug` panel and then by clicking on the `Run and Debug` button.
|
|
You can also run directly the `Debug: Start Debugging` command instead of using the UI. In some circumstances the UI may offer a selection of languages, in which case select `Ada`.
|
|
The extension will then propose you to select the main you want to debug if your project contains several mains.
|
|
|
|
If you want to customize GDB's behavior or if you need to add custom arguments, you
|
|
will have to create a `launch.json` file: this can be done by click the gear icon
|
|
on the right side of one of the debug configurations proposed by the menu.
|
|
Alternatively, you can click the
|
|
`create a launch.json file` link button in the `Run and Debug` panel or use
|
|
the `Debug: Add Configuration` command.
|
|
|
|
Now let's replace `hello_world.adb` with something more complex:
|
|
|
|
```ada
|
|
with Ada.Text_IO;
|
|
|
|
procedure Hello_World is
|
|
procedure Print (Text : String) is
|
|
begin
|
|
Ada.Text_IO.Put_Line (Text);
|
|
end Print;
|
|
|
|
Text : String := "Hello Ada World!";
|
|
begin
|
|
Print (Text);
|
|
Text := "xxxxx xxx xxxxx.";
|
|
Print (Text);
|
|
end Hello_World;
|
|
```
|
|
|
|
By default, no breakpoints are added to
|
|
your source code. Let's put a breakpoint on the line with `Print` call.
|
|
To do this switch to the `hello_world.adb` tab in the code editor,
|
|
putting the insertion point somewhere on the `Print` statement,
|
|
and pressing `F9`. A red dot appears in the gutter on the left
|
|
to indicate that a breakpoint has been set on this line.
|
|
|
|

|
|
|
|
### Start a debugging session
|
|
|
|
1. Go back to `hello_world.adb` so that it is the active file.
|
|
2. Press `F5` or from the main menu choose **Run** > **Start Debugging**.
|
|
Before you start stepping through the code, let's take a moment to notice
|
|
several changes in the user interface:
|
|
|
|
* The Integrated Terminal appears at the bottom of the source code
|
|
editor. In the **Debug Output** tab, you see output that indicates
|
|
the debugger is up and running.
|
|
|
|
* The editor highlights the statement where debugger stops on the
|
|
breakpoint:
|
|
|
|

|
|
|
|
* The Run view on the left shows debugging information. You'll see
|
|
an example later in the tutorial.
|
|
|
|
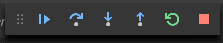
* At the top of the code editor, a debugging control panel appears.
|
|
You can move this around the screen by grabbing the dots on the
|
|
left side
|
|
|
|
|
|
|
|
### Step through the code
|
|
|
|
Now you're ready to start stepping through the code.
|
|
|
|
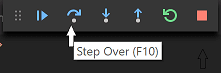
1. Click `F10` or press the **Step over** icon in the debugging control panel.
|
|
|
|
|
|
|
|
This will advance program execution to the assignment statement, and
|
|
skip over the Print procedure call. See value of the `Text` variable
|
|
on the left panel. Also take a look at **Debug Console** to see the
|
|
`Put_Line` output.
|
|
|
|
2. Press **Step over** again to advance to the next statement in this
|
|
program (skipping over assignment statement execution). Notice the
|
|
change in the Variables window on the side.
|
|
|
|

|
|
|
|
3. To quickly view the value of any variable while execution is paused
|
|
on a breakpoint, you can hover over it with the mouse pointer.
|
|
|
|
4. Try **Step Into** button to step in the `Print` procedure.
|
|
|
|
## Reusing your Ada configuration
|
|
|
|
VS Code is now configured to use Ada. The configuration applies to
|
|
the current workspace. To reuse the configuration for another project, just copy
|
|
the `.vscode` folder into the other project folder
|
|
(workspace) and change the names of the project file and
|
|
executables as needed.
|
|
|
|
Note that you can convert your `.vscode` folder into a workspace file (`.code-workspace` extension) if
|
|
you need a [Multi-root Workspace](https://code.visualstudio.com/docs/editor/workspaces#_multiroot-workspaces).
|
|
Multi-root workspaces allow to have workspaces containing multiple root folders: this is really useful for projects
|
|
that import other projects for instance. When loading such a project, the Ada extension will display a popup offering to automatically add all the source directories coming
|
|
from imported projects to the workspace.
|
|
That would then allow you to navigate quickly among imported sources via the `Ctrl+P` key shortcut.
|
|
|
|
## Troubleshooting
|
|
|
|
If you encounter issues while using Ada in VS Code, you may find useful information in the logs available in the **Output** view of VS Code. The logs can be accessed using the following commands:
|
|
|
|
* `Ada: Show extension output`
|
|
* `Ada: Show Ada Language Server output`
|
|
* `Ada: Show GPR Language Server output`
|
|
|
|
Verbosity of the language server outputs can be increased with the following settings:
|
|
|
|
```json
|
|
{
|
|
"ada.trace.server": "verbose",
|
|
"gpr.trace.server": "verbose"
|
|
}
|
|
```
|
|
|
|
You can report bugs via the `Help: Report Issue` command in VS Code, or by [opening an issue on GitHub](https://github.com/AdaCore/ada_language_server/issues/new?assignees=&labels=bug&projects=&template=bug-report.yaml&title=%5BBug%5D%3A+).
|
|
|
|
## Next steps
|
|
|
|
* Explore the
|
|
[VS Code User Guide](https://code.visualstudio.com/docs/editor/codebasics).
|